Citi Mappers: Broadband Edition
Citi Mappers: Broadband Edition https://www.citizenme.com/wp-content/themes/corpus/images/empty/thumbnail.jpg 150 150 Georgie Morgan https://secure.gravatar.com/avatar/df448d716dcccf5cd59a0459a07ce224?s=96&d=mm&r=gCiti Mappers: Broadband Edition
We mapped Citizen's broadband insights and this is what happened
Sometimes the story’s about the story, and sometimes the story’s about the data – in this case it’s about broadband insights. We wanted to understand the differences in broadband speed across the UK and what impacted this. To do this, we surveyed 500 UK Citizens who were asked to test their home internet upload and download speed using an in-app link and our prototyping tool.
CitizenMe is unique in that we are a supplier of data without holding any personal data. None. Zero. Zilch. Instead, because all the data you see is held on individual Citizen phones, it’s up to Citizens to decide what happens with their data. Check out more about the CitizenMe app here.
Claimed vs Actual Data
We know that, with all the good intentions in the world, what people say they do isn’t necessarily what they do. Whether it’s the inability to recall specific actions, cognitive bias or any of a myriad number of other factors, what people claim isn’t necessarily a true reflection of what they do.
Prototypes were designed to help overcome this. Advanced questions such as Prototypes, images, gifs and videos enable Citizens to respond live and in stream. So, what people say, what they do and how they behave can now be visualised all in the same place.
Prototypes give Citizens the chance to enjoy a more interactive, varied and fun way of taking surveys, and to give clients the chance to incorporate user-experience (UX) testing into the heart of customer surveys for the first time.
Check out more about prototype testing here.
What did we do?
Because we wanted to understand key audience differences, we also asked Citizens to share some of the 400+ passive/behavioural datapoints by which they can be identified via their CitizenData. These included:
- Gender
- Age
- Region of residence
- Postcode area and sector
- UK social class
- Living situation
- Home area
To supplement this with a ‘commercial’ view, we also asked the following questions:
- Who is your current broadband provider? (Multiple choice)
- How much do you pay for their broadband and line rental? (Single choice)
- Would you be happy to participate in an activity to test your broadband speed? (Prototype)
- Test and screenshot your broadband speed (Image upload)
A prototype question was used to get Citizens to test their broadband speed, allowing us to gain deeper broadband insights. This outlined to Citizens how to access this webpage https://www.broadbandspeedtest.org.uk/ and screenshot the results. Alongside upload and download speed, the screenshot also included provider, ping speed and latency.
Citizens then uploaded these results to their app. The broadband speeds reported by Citizens should therefore be completely accurate as there is no claimed data, just screenshots from the broadband speed test website.
From this, we can provide a rich, detailed and accurate ‘mapping’ of UK broadband speeds. This provides real-time broadband insights from across the UK.
What we found?
1. Virgin Territory
The results? Well, Virgin Media was both the most used provider and also offered the fastest download average speed. For uploading, Vodafone offered the quickest average speed.
We also saw some interesting differences in household type, with those either living with their parents (£30.73) or their children (£30.31) both paying, on average, 25%+ per month more than those living alone (£23.98).
However, the price paid was also a reflection of download speeds, with those living alone tending to have the slowest average download speed (63mbps), compared to those who live with their children averaging 78mbps, and the fastest download speed belonging to those who live with their parents, averaging 94mbps.
2. Explore the data
The interactive map on which our broadband location insights & findings were based, and which you can now access free of charge, is here. Each layer on the map represents a different lens under which you can look at the data. For example, if you want to understand how the price of broadband varies across the country, click the price checkbox and this layer will be generated.
Conclusion
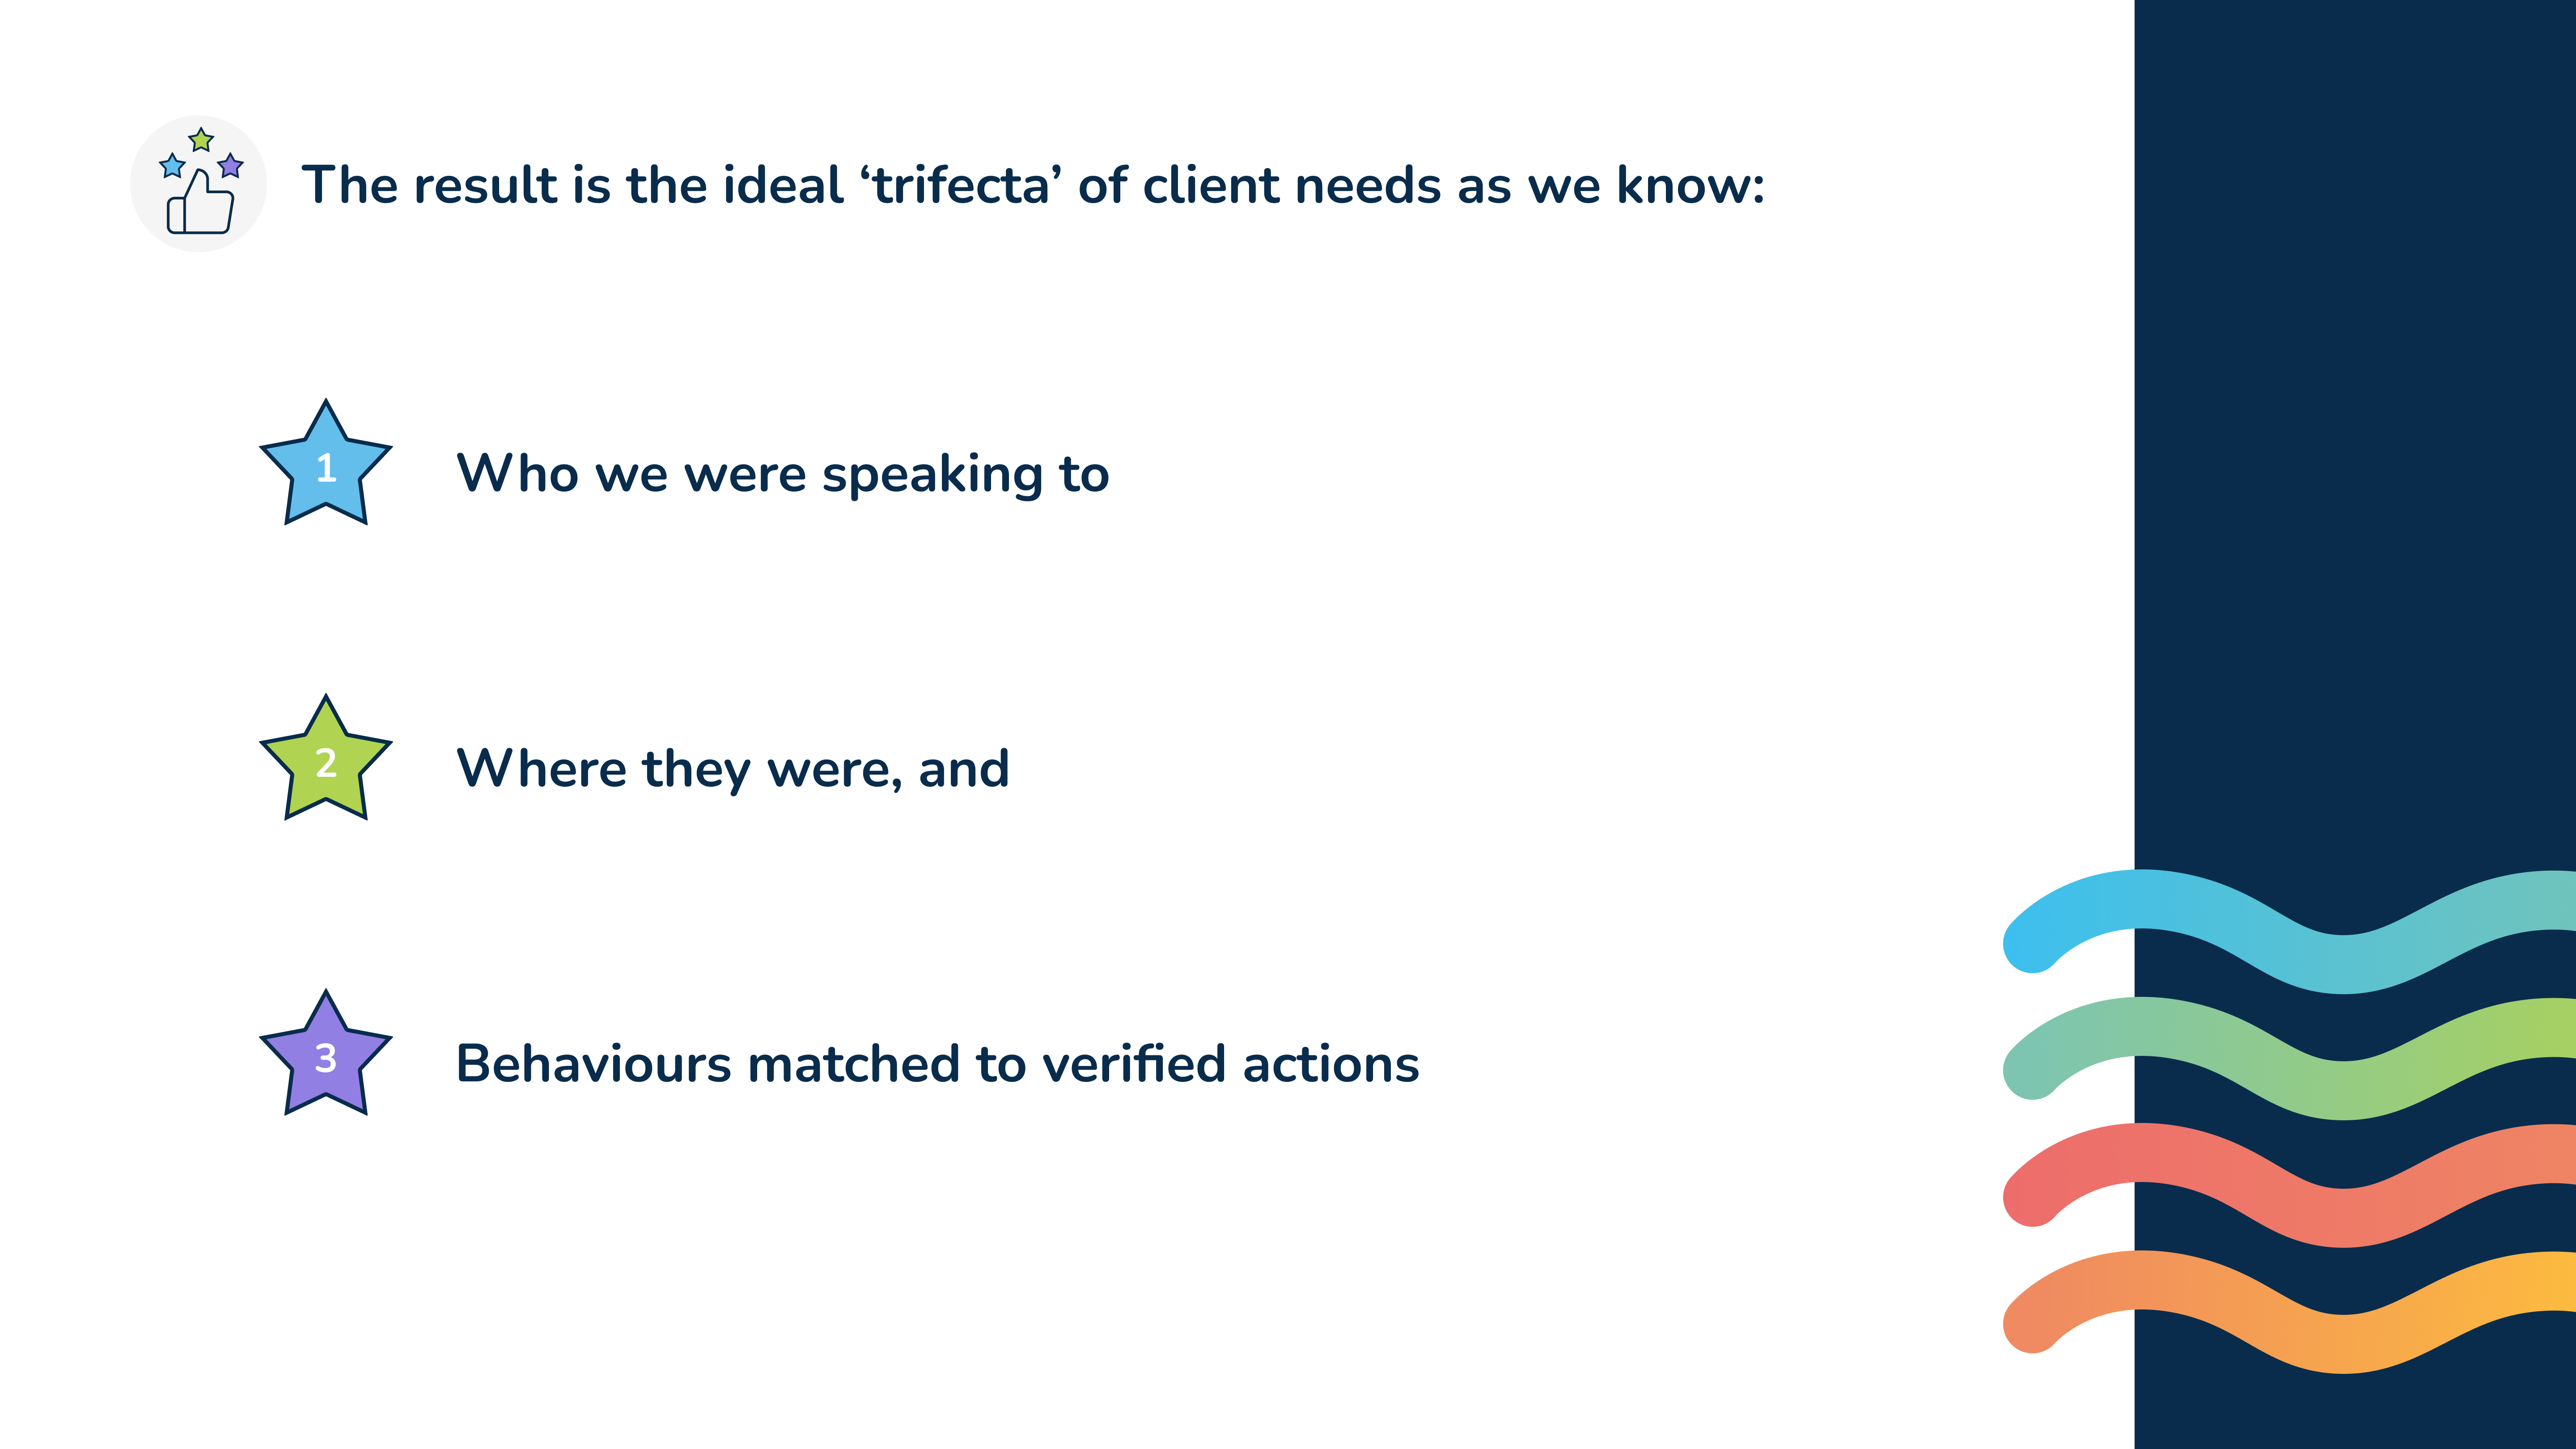
In addition to the broadband insight results, the key for us was being able to show that the future of data centred around the individual, is here. You’re able to know who you’re speaking to and verify actions. The more accurate your understanding of your customers, your data, and your world, the lower the risk you carry. Our mission is to build in that certainty, provide confidence in the data you use and lower your risk. We believe that a healthy information economy produces sustainable growth and more accurate, more valuable data for businesses. Real people, real data, shared ethically and honestly creates less liability and more opportunity.
By providing an unprecedented variety of verified Citizen zero-party data without data risk; by revealing CitizenData through the magic of tech using new functions like Prototypes, and by empowering Citizens to take control of their data, and how and when it’s used, we’ve reached the next stage. But the future of data is yours.
See how we can transform your data world!
Sign up for the CitizenMe Marketplace platform, or book an appointment with our business development team.