Broadband Mapping and Insights
Broadband Mapping and Insights https://www.citizenme.com/wp-content/uploads/2022/06/Broadband-Case-study-image-1.png 1000 474 Georgie Morgan https://secure.gravatar.com/avatar/df448d716dcccf5cd59a0459a07ce224?s=96&d=mm&r=gThe Challenge
This research aimed to understand the differences in broadband speed across the country and what impacted this. We recruited 500 UK respondents who were asked to test their home internet upload and download speed using a link and our Prototype question. We cleansed the data and filtered the 500 down to 290 as some were not able to complete it at the time (travelling, no home internet etc.) and others provided less than quality images which were then omitted. They were also asked to answer a few questions about their broadband including provider and price paid. The results were then analysed across a range of factors including region, home area, provider and social grade
The CitizenMe Solution
We used a combination of CitizenData such as gender, age, region of residence, postcode area and sector, UK social class, living situation and home area with some additional custom questions. These included a combination of single choice, multiple choice, Prototype and image upload.
The Prototype question outlined to Citizens how to access this webpage https://www.broadbandspeedtest.org.uk/ and screenshot the results. They were then asked to upload these results to their CitizenMe app. The broadband speeds reported by Citizens should therefore be completely accurate as there is no claimed data, just screenshots from the broadband speed test website.
The Result
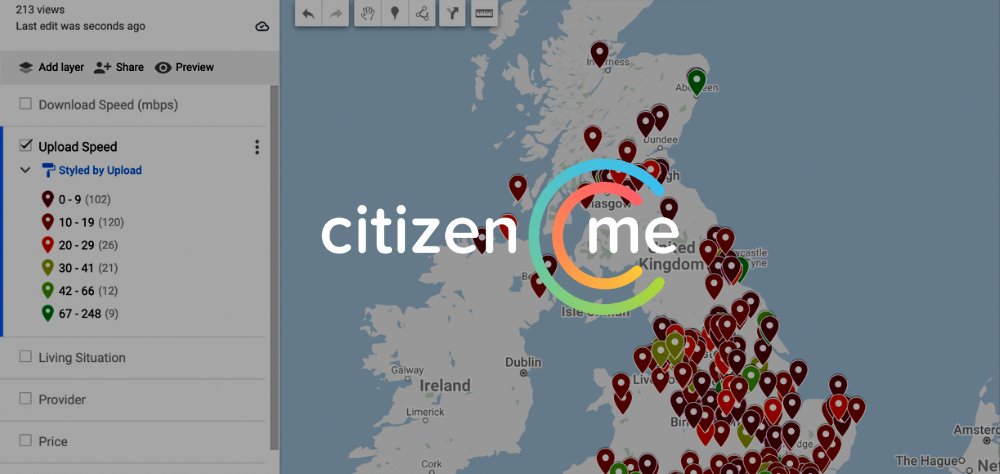
The map of the findings can be found by clicking here. The map allows you to add or remove layers and see how that metric looks across the country. For example, if we click download speed you can see the peaks and troughs of download speed across the UK. Further data can be seen by clicking on the individual pinpoints including living situation and broadband provider.
You can read a more in-depth blog on the broadband insights case study, here.